Sleep Trackers Explained – What Do They Actually Measure?
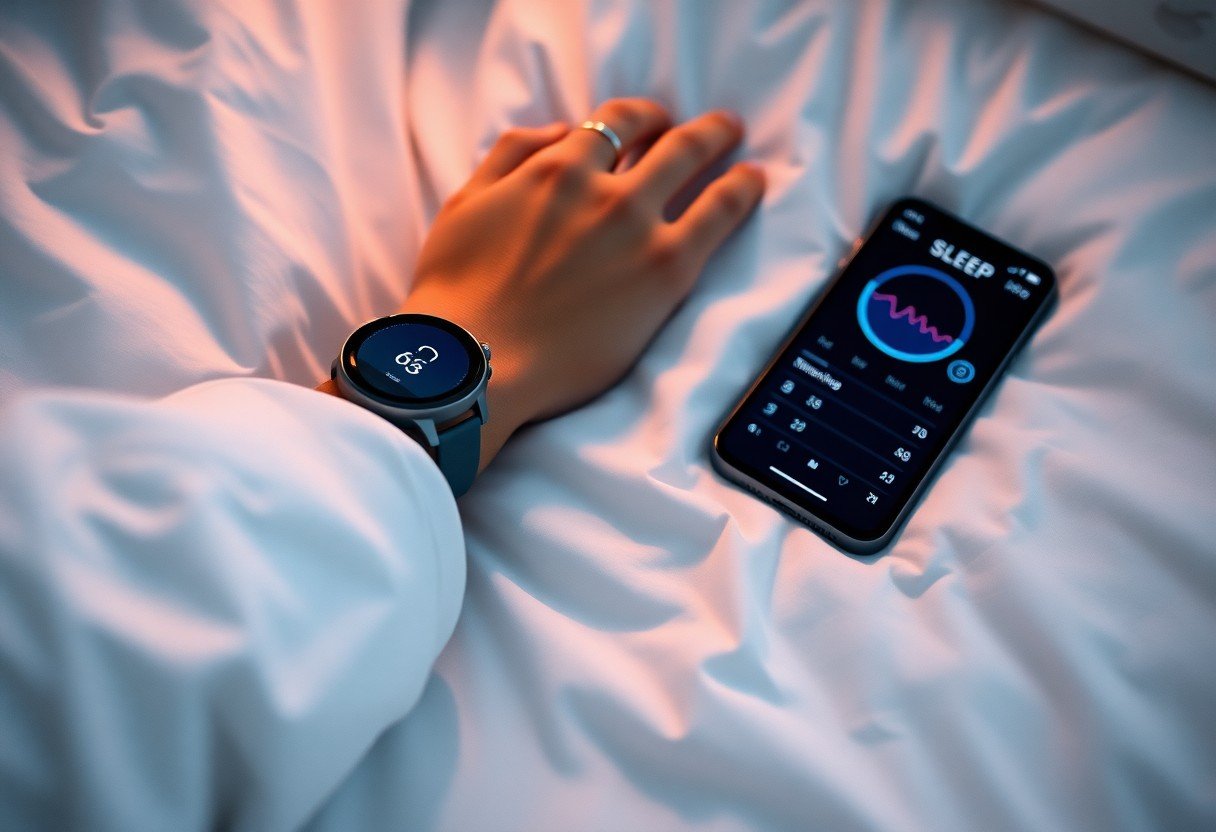
Over the past decade, wearable devices and smart beds have slipped into bedrooms worldwide, quietly recording your nights in pursuit of better rest. You likely already know when you feel unrested, but these tools claim to reveal the hidden mechanics behind those feelings. They log movement, estimate sleep stages, and sometimes monitor heart rate or breathing patterns, all while you lie unaware. What they actually capture, however, depends as much on the technology’s limits as on your physiology. A mid-sized SaaS firm’s employee wearing a popular wrist tracker might see detailed sleep scores, yet miss the deeper context of sleep quality that only clinical tools can provide.
The Mechanical Bedfellow
Accelerometer Mechanics
Your sleep tracker relies on a small component called an accelerometer to detect movement throughout the night. This sensor measures changes in velocity across multiple axes, translating physical motion into digital data. When you shift positions or remain still for extended periods, the device interprets these patterns as indicators of sleep stages, particularly distinguishing between restlessness and deep inactivity.
Most wrist-worn devices sample motion dozens of times per second, creating a detailed timeline of your night’s activity. A prolonged absence of significant movement often signals the algorithm that you are asleep, while frequent bursts suggest wakefulness or light sleep. Though effective at identifying broad sleep-wake cycles, accelerometers cannot detect brainwave changes or eye movements, limiting their accuracy in differentiating REM from deep sleep.
Consider a mid-sized SaaS firm employee who wears a fitness band nightly. The device consistently logs eight hours of sleep, yet she feels unrested. Reviewing the data reveals frequent micro-movements, classified as wake time, explaining her fatigue despite apparent duration. Such cases highlight how motion data alone provides an incomplete picture of true sleep quality.
Optical Heart Sensors
Photoplethysmography, or PPG, forms the basis of most optical heart rate sensors in consumer sleep trackers. These sensors emit green light into your skin and measure how much reflects back, detecting blood volume changes with each heartbeat. By analyzing these fluctuations, your device estimates heart rate and, by extension, heart rate variability (HRV) during sleep.
Green light is used because it effectively scatters in blood-rich tissue, making it sensitive to pulse-related changes. However, signal accuracy depends on consistent contact with the skin and can falter during excessive movement or in individuals with darker skin tones due to higher melanin absorption. Intermittent readings may create gaps or inaccuracies in overnight HRV trends.
One user wearing a smartwatch during sleep noticed erratic HRV data across consecutive nights. Upon inspection, the device had loosened during the night, causing inconsistent light penetration. Tightening the band improved data continuity, illustrating how physical fit directly influences sensor reliability. These sensors work best when worn snugly but comfortably, minimizing motion artifacts.
Optical sensors also infer respiratory rate by identifying subtle variations in pulse timing linked to breathing cycles. While not as precise as clinical monitors, they offer a general estimate useful for spotting long-term trends rather than diagnosing conditions.
The Nightly Calculus
Light Sleep Markers
Sleep trackers interpret light sleep by detecting small shifts in body movement and heart rate variability throughout the night. During this phase, your breathing becomes more regular and muscle activity decreases slightly compared to wakefulness. Devices use accelerometers to sense these minimal motions, pairing that data with heart rate patterns to estimate when you enter and exit light sleep stages.
Most consumer wearables classify light sleep as a transitional zone between full wakefulness and deeper recovery phases. A mid-sized SaaS firm’s internal wellness study observed employees logging an average of three hours in light sleep per night, consistent with general population norms. This stage typically occupies the largest portion of your sleep cycle, especially in the first half of the night.
Patterns in light sleep can reveal disruptions caused by environmental noise or caffeine consumption. Frequent spikes in heart rate or motion during this phase may signal poor sleep quality even if total duration appears adequate. One user noticed a 20% drop in recorded light sleep after switching to evening espresso, illustrating how trackers can highlight behavioral sensitivities.
Dreaming States
Dreaming primarily occurs during REM sleep, a phase marked by rapid eye movements, increased brain activity, and temporary muscle paralysis. Your tracker infers REM onset by combining heart rate acceleration, respiratory changes, and prolonged stillness. These signals resemble waking brain function, making REM distinct from other stages despite physical inactivity.
Most devices estimate REM duration rather than confirming dreaming directly, as actual dream content remains inaccessible to sensors. A typical night includes four to six REM cycles, each lengthening progressively. Trackers often show your longest REM window in the final third of sleep, aligning with reports of vivid morning dreams.
Consistency in REM timing can reflect circadian stability, while irregular patterns may correlate with stress or sleep deprivation. Users recovering from illness sometimes observe compressed REM phases, suggesting the body prioritizes deep sleep for repair. One longitudinal user log showed REM rebound after a week of restricted sleep, with nightly REM increasing by nearly 40 minutes over three days.
Some trackers now use machine learning to identify micro-movements in the eyes or facial muscles, though these features remain experimental. Current consumer models rely on indirect proxies, meaning REM data should be viewed as an approximation. Despite limitations, trends over time offer insight into mental recovery and emotional regulation, particularly when paired with mood journaling.
Surrounding Variables
Environmental conditions in your bedroom influence how sleep trackers interpret your rest, even when those conditions don’t directly affect your body. Sound, temperature, and light levels can all introduce noise into the data collected by your device, especially if it relies on ambient sensors. A partner’s late-night movements or a pet jumping on the bed may register as your own, skewing wakefulness estimates. These external inputs are rarely accounted for in consumer-grade algorithms, leading to inconsistencies across seemingly identical nights. Your tracker cannot distinguish between your restlessness and someone else’s activity nearby.
Acoustic cues often play a larger role than manufacturers disclose. Some devices use built-in microphones to detect snoring or sleep talking, attempting to correlate sound patterns with sleep stages. Yet background noise from traffic, HVAC systems, or a partner’s breathing can distort these readings. A sudden noise might prompt a physiological response you’re unaware of, but the tracker logs it as a full awakening. These misinterpretations accumulate, especially in urban environments or shared sleeping spaces, where acoustic interference is routine rather than exceptional.
Temperature shifts in your room can also alter sensor performance and sleep stage predictions. Many wearables use skin temperature as a proxy for core body temperature trends during sleep. When room temperature fluctuates-due to seasonal changes or faulty climate control-your skin’s response may not reflect your internal state. A cold draft could cause peripheral vasoconstriction, misleading the device into thinking you’ve entered a deeper sleep phase. Even bedding material affects thermal conductivity, subtly changing how your wearable reads your body’s signals throughout the night.
Acoustic Interference
Sound in your sleeping environment often disrupts the accuracy of sleep tracking, particularly for devices equipped with audio monitoring features. These tools attempt to identify snoring episodes or breathing irregularities by analyzing ambient noise, but they lack the filtering capacity of clinical equipment. A partner’s cough, a barking dog outside, or a creaking floorboard may be misclassified as your own respiratory event. The device logs these moments as interruptions, inflating your reported wake time without reflecting your actual sleep continuity.
Some trackers use sound to estimate sleep stages, assuming silence correlates with deep sleep and vocalizations indicate lighter phases. This logic fails in dynamic households where noise is constant but non-disruptive. A child’s monitor chirping intermittently might not wake you, yet the tracker flags each instance as a disturbance. Over time, these false positives distort your sleep efficiency score, making rest appear more fragmented than it feels. The mismatch between perceived and recorded rest becomes especially pronounced in shared or noisy environments.
Even voice-activated assistants near the bed can interfere with audio-based tracking. Devices that listen for wake words may inadvertently trigger recording modes during the night, capturing snippets of sound that the sleep algorithm later analyzes. These unintended recordings introduce unpredictable variables into the dataset, further reducing reliability. Without manual review or advanced noise discrimination, your tracker cannot differentiate between meaningful physiological sounds and irrelevant background chatter.
Thermal Fluctuations
Room temperature changes affect both your sleep quality and the data your tracker collects. Wearables often monitor skin temperature to infer circadian rhythms and sleep stages, assuming a steady decline correlates with sleep onset. When your bedroom warms unexpectedly-due to sunlight or a heating system cycling on-your skin temperature may rise instead of fall. The device interprets this deviation as delayed sleep initiation or increased wakefulness, even if you fall asleep without difficulty.
External heat sources like electric blankets or heavy bedding alter thermal readings independent of your body’s natural regulation. A heated mattress pad might elevate skin temperature, causing the tracker to underestimate your deep sleep duration. Conversely, sleeping in a cold room with insufficient covers can trigger vasoconstriction, mimicking the thermal profile of lighter sleep. These environmental factors introduce systematic biases that are rarely adjustable in consumer apps.
Seasonal shifts compound these inaccuracies, especially in homes without climate control. Summer nights with high humidity reduce evaporative cooling, making it harder for your body to lower its core temperature. Your tracker may register this as prolonged light sleep, despite your subjective sense of restfulness. Over months, these thermal discrepancies accumulate, distorting long-term sleep trends and potentially misleading your behavioral adjustments.
Thermal sensors in wearables typically sample data from a single point on your wrist, which responds more quickly to ambient changes than your core does. This creates a lag between what the device measures and your actual physiological state. A sudden breeze from an open window may cool your skin within minutes, but your core temperature remains stable. The tracker, however, may log this as a micro-awakening or a shift in sleep stage, simply because the surface reading changed. These transient fluctuations are common but rarely meaningful, yet they persist in your sleep history as anomalies.
Vital Signs
Modern sleep trackers go beyond movement to assess key physiological metrics during rest. Your device may record heart rate using photoplethysmography, where green or red light detects blood volume changes beneath the skin. These fluctuations help estimate beats per minute throughout the night, revealing trends like nocturnal dips tied to deep sleep stages. A mid-sized SaaS firm’s wellness program found employees with lower average nighttime heart rates reported higher focus during workdays.
Blood oxygen saturation is another parameter captured by many wrist-worn devices. Sensors emit light into capillary beds, measuring how much is absorbed by oxygenated versus deoxygenated blood. While clinical pulse oximeters use fingertip probes for accuracy, consumer wearables apply similar principles with adjusted expectations. Some users noticed discrepancies during altitude hikes, where tracker readings lagged behind medical devices by several percentage points.
Respiratory rate often derives from heart rate variability or chest movement proxies. Though not directly measured like in a sleep lab, algorithms infer breathing patterns from pulse intervals. One user’s tracker flagged elevated nighttime respiration for three consecutive nights, prompting a check-up that revealed mild bronchitis. These indirect methods offer insight but work best when trends are viewed over time, not as isolated data points.
Oxygen Monitoring
Oxygen monitoring in consumer sleep trackers typically relies on pulse oximetry, a non-invasive method that estimates blood oxygen levels. Your device uses light-emitting diodes to penetrate skin tissue, analyzing how much light is absorbed by hemoglobin. Most trackers sample intermittently rather than continuously, conserving battery while still detecting notable drops during sleep. This approach helped one frequent flyer identify recurring desaturation episodes above 8,000 feet, prompting use of supplemental oxygen.
Accuracy varies significantly between wrist-based sensors and fingertip medical devices. Skin tone, tattoo ink, and motion can interfere with light absorption readings, leading to inconsistent results. Some users with darker skin tones reported less reliable data, consistent with known limitations of optical sensors. Manufacturers continue refining algorithms, but clinical validation remains limited for most models on the market.
Episodes of low oxygen saturation, known as hypoxemia, may correlate with sleep apnea or respiratory conditions. Your tracker might flag events where SpO2 falls below 90% for extended periods, though thresholds differ across brands. One long-term user noticed repeated dips during winter months, which aligned with increased asthma symptoms. These alerts are not diagnostic but can prompt timely medical consultation.
Breathing Patterns
Breathing patterns are inferred through indirect signals such as heart rate variability and subtle body movements. Your tracker analyzes fluctuations in pulse intervals, which often mirror respiratory cycles due to the cardiorespiratory connection. Some advanced models use accelerometers to detect chest motion, estimating breaths per minute with moderate precision. A user with sleep anxiety observed irregular breathing spikes during REM phases, later confirmed by polysomnography.
Irregular breathing may indicate conditions like periodic breathing or apnea events, especially when paired with oxygen drops. Algorithms look for rhythmic rises and falls in respiration rate, flagging anomalies for review. One individual’s data showed consistent pauses lasting 10-15 seconds, prompting a sleep study that diagnosed obstructive sleep apnea. These insights are most useful when combined with other symptoms and professional evaluation.
Longitudinal tracking allows you to spot trends in respiratory regularity across weeks or months. Seasonal allergies, illness, or changes in sleep position can influence breathing stability. A runner recovering from bronchitis used nightly respiration data to monitor improvement, noting a return to baseline after three weeks. While not a substitute for clinical tools, consistent pattern recognition adds context to overall sleep health.
Some trackers now offer guided breathing exercises based on your resting rate, aiming to improve pre-sleep relaxation. These features use your historical data to suggest personalized breathwork rhythms, such as inhaling for four seconds and exhaling for six. One user reported falling asleep 20 minutes faster after integrating nightly breathing routines, though individual results vary. The integration of passive monitoring with active interventions represents a growing trend in consumer sleep technology.
The Precision Problem
Lab Equipment Disparities
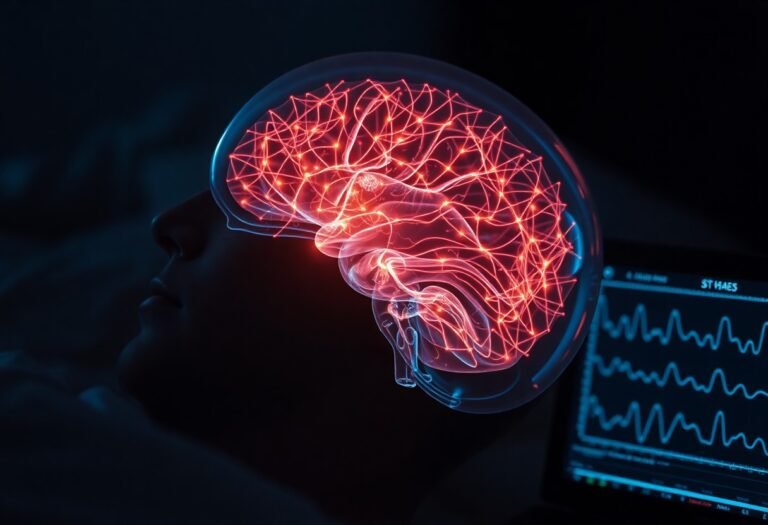
Polygraph-grade polysomnography systems in sleep clinics monitor brainwave activity, eye movement, and muscle tone through multiple electrodes. Your wearable, in contrast, relies on motion and pulse data collected from your wrist. A study comparing consumer devices to clinical equipment showed notable divergence in sleep stage detection, particularly in identifying REM cycles. Even high-end trackers often misclassify light sleep as deep sleep due to the absence of neural data. One participant’s device recorded 90 minutes of deep sleep when lab results showed only 32. These discrepancies stem from fundamental differences in data acquisition, not minor calibration issues. Without access to EEG signals, no wrist-based device can match the clinic’s accuracy.
Medical-grade equipment operates under controlled conditions with trained technicians ensuring proper sensor placement. Your tracker functions in variable environments-loose straps, inconsistent wear position, or arm movement during sleep introduce noise. A mid-sized SaaS firm conducted an internal wellness study and found that employees’ devices registered wake periods during sleep due to tossing and turning. The same motion that signals restlessness to a lab technician registers as full wakefulness in algorithmic models. Even slight variations in skin tone or tattoo coverage can affect optical sensor performance. These real-world variables compound inaccuracies already present in the hardware design.
Manufacturers often validate their devices using small, homogenous test groups under ideal conditions. Real users span diverse body types, sleep behaviors, and health conditions not reflected in those trials. A device calibrated on healthy young adults may underperform for older users or those with circadian disorders. One user with sleep apnea reported consistent underestimation of wake events by their tracker. Clinical tools detect respiratory effort and oxygen saturation; consumer models infer disruptions solely from heart rate spikes. Without direct measurement of breathing, such inferences remain speculative. These hardware limitations are not flaws-they are inherent constraints of the technology.
Software Interpretations
Algorithms transform raw sensor data into sleep stages using proprietary models trained on limited datasets. Your tracker might label a period of low movement and steady heart rate as deep sleep, even if your brain remains active. These models rely on statistical correlations rather than physiological confirmation. One user noticed their device recorded deep sleep during a cross-country flight, despite being fully awake and watching movies. The prolonged inactivity and reclined position misled the algorithm. Different brands often report conflicting results for the same night, revealing the subjectivity embedded in software logic. No universal standard governs how motion and pulse data translate into sleep stages. Each company applies its own assumptions, leading to inconsistent user experiences.
Updates can shift how your sleep is scored without notice, altering historical trends. A firmware change might redefine what qualifies as REM, making past data incomparable. One long-term user found their average deep sleep dropped by 20 minutes overnight, not due to lifestyle changes but a software revision. These invisible recalibrations undermine the reliability of longitudinal tracking. Machine learning models evolve silently, adjusting thresholds based on aggregated data that may not reflect your physiology. The lack of transparency prevents users from understanding how conclusions are drawn. You see a sleep score, but never the logic behind it.
Some apps assign sleep quality scores using weighted averages of duration, restlessness, and heart rate variability. Your score might drop because your resting heart rate rose by two beats per minute, even if you feel well-rested. These metrics prioritize numerical consistency over subjective experience. A user recovering from illness might show disrupted patterns, yet feel improvement day by day-data and perception diverge. The software does not account for context, such as stress, medication, or hydration. It treats all heart rate fluctuations as equal, regardless of cause. This rigid interpretation risks misrepresenting your actual rest.
Proprietary algorithms often treat sleep as a uniform process, ignoring individual variation in sleep architecture. One person’s typical REM cycle might register as an anomaly in a model trained on population averages. A teacher with irregular work hours found her tracker consistently flagged her sleep as poor, despite maintaining energy and focus. The software interpreted her delayed bedtime as dysfunction, not adaptation. These models assume a standardized sleep ideal, usually based on eight-hour nocturnal patterns, which excludes shift workers, new parents, or biphasic sleepers. Without customizable baselines, the feedback becomes irrelevant or misleading. The software interprets your biology through a narrow lens, privileging data patterns over lived reality.
Meaningful Habits
Longitudinal Trends
Patterns in your sleep data become meaningful only when observed over weeks or months. A single night of poor sleep may reflect a late coffee or stressful meeting, but consistent dips in deep sleep across several weeks could signal a developing issue. Tracking your入睡 latency, wake after sleep onset, and total sleep time reveals gradual shifts that isolated snapshots miss. One user noticed a steady increase in nighttime awakenings over two months, prompting a thyroid check that revealed an underlying condition. These slow changes are invisible in daily readings but stand out clearly in long-term graphs. Your body rarely shifts habits overnight, and neither should your interpretation of its signals.
Most consumer devices store months of data, allowing you to correlate sleep quality with lifestyle adjustments. When a mid-sized SaaS firm encouraged employees to review six-week sleep logs, several linked improved rest to reduced screen time after 9 p.m. Seasonal variations also emerge, such as longer REM cycles during winter months or disrupted rhythms during travel seasons. Without extended tracking, these trends remain hidden beneath daily noise. The real value of sleep trackers lies not in nightly scores but in identifying these subtle, persistent patterns over time.
Software algorithms often smooth raw data to highlight overarching trends, filtering out one-off anomalies. You might overlook a single night of 40% light sleep, but a rising average over five weeks demands attention. Some platforms flag gradual declines in sleep efficiency before you feel overt fatigue. This foresight enables proactive changes, like adjusting bedtime or reducing alcohol intake, before performance suffers. Long-term tracking transforms subjective feelings of tiredness into objective, actionable timelines.
Routine Refinement
Adjusting your evening habits based on tracker feedback can yield measurable improvements in sleep quality. If your device consistently records elevated heart rate during the first hour in bed, it may indicate insufficient wind-down time. Introducing a 30-minute screen-free buffer with reading or light stretching could lower that metric within days. One user reduced nighttime awakenings by shifting dinner earlier, a change prompted by repeated correlations between late meals and fragmented sleep. These micro-adjustments, guided by data, refine routines more effectively than generic advice.
Your tracker might reveal that weekend lie-ins delay Monday night sleep onset, disrupting weekly rhythm. Observing this pattern allows you to limit oversleep to 60 minutes, preserving circadian alignment. Caffeine’s impact also becomes clearer when matched against sleep latency; a 3 p.m. soda might not keep you awake, but it could reduce deep sleep by 15 minutes. Over time, these small insights accumulate into a personalized protocol. You begin to anticipate how specific choices ripple through your rest.
Consistency in bedtime and wake time often emerges as the strongest predictor of stable sleep efficiency. When deviations occur, your tracker provides immediate feedback, reinforcing discipline. A teacher using a wearable noticed that skipping her usual 10 p.m. herbal tea led to longer入睡 latency on three out of four trials. This feedback loop strengthens habit formation by linking behavior directly to outcome. Routine refinement turns abstract goals into tangible, daily choices.
Refining your routine is not about perfection but precision. You learn which habits carry the most weight through repeated observation, not guesswork. Over time, your tracker becomes less a monitor and more a mirror, reflecting the real impact of your choices.
Final Words
Sleep trackers interpret your rest through motion, heart rate, and sound, translating physical signals into sleep stages and duration estimates. You receive data suggesting when you drifted off, how long you stayed in light or deep sleep, and how often you stirred. These insights, while not medical-grade, offer a general sense of your nightly patterns over time.
Accuracy varies widely between devices, especially when distinguishing between light, deep, and REM sleep. A wrist-based tracker might mistake stillness for deep sleep or misread awakenings due to minor movements. Even so, consistent trends-such as a gradual decline in restfulness after late caffeine intake-can reveal meaningful correlations you might otherwise overlook.
What matters most is how you use the information. Relying on sleep trackers to diagnose disorders leads to misinterpretation, but using them to reinforce better habits-like maintaining a regular bedtime or reducing screen exposure-can support long-term improvement. One mid-sized SaaS firm introduced sleep hygiene workshops after employees reported anxiety over inaccurate tracker data, emphasizing behavioral change over numerical obsession.